

LinkedIn Post Analytics 2026: Saves, Sends and Reach Explained
Short answer
On November 3, 2026, LinkedIn launched a Post Performance Table showing saves, sends, follower attribution and network reach for each post, alongside existing metrics. It's rolling out to creators and business pages, though LinkedIn hasn't confirmed full availability yet. For entrepreneurs and B2B brands, these numbers show which posts get shared and followed, not just seen.
A founder checks her LinkedIn analytics the morning after a post does unusually well.
She's used to seeing impressions, reactions and comments, and not much else.
This time there's a new tab called Post Performance, showing numbers she's never seen on a single post before: saves, sends, and a count of new followers tied directly to that one update.
She's not sure yet what any of it means for what she should post next.
That's the real value behind LinkedIn post analytics 2026: a set of numbers that show what people actually did with a post, not just whether they scrolled past it. Here's what LinkedIn announced on November 3, what each new metric measures, and how to read them without overreacting to any single post.
What LinkedIn Announced on November 3
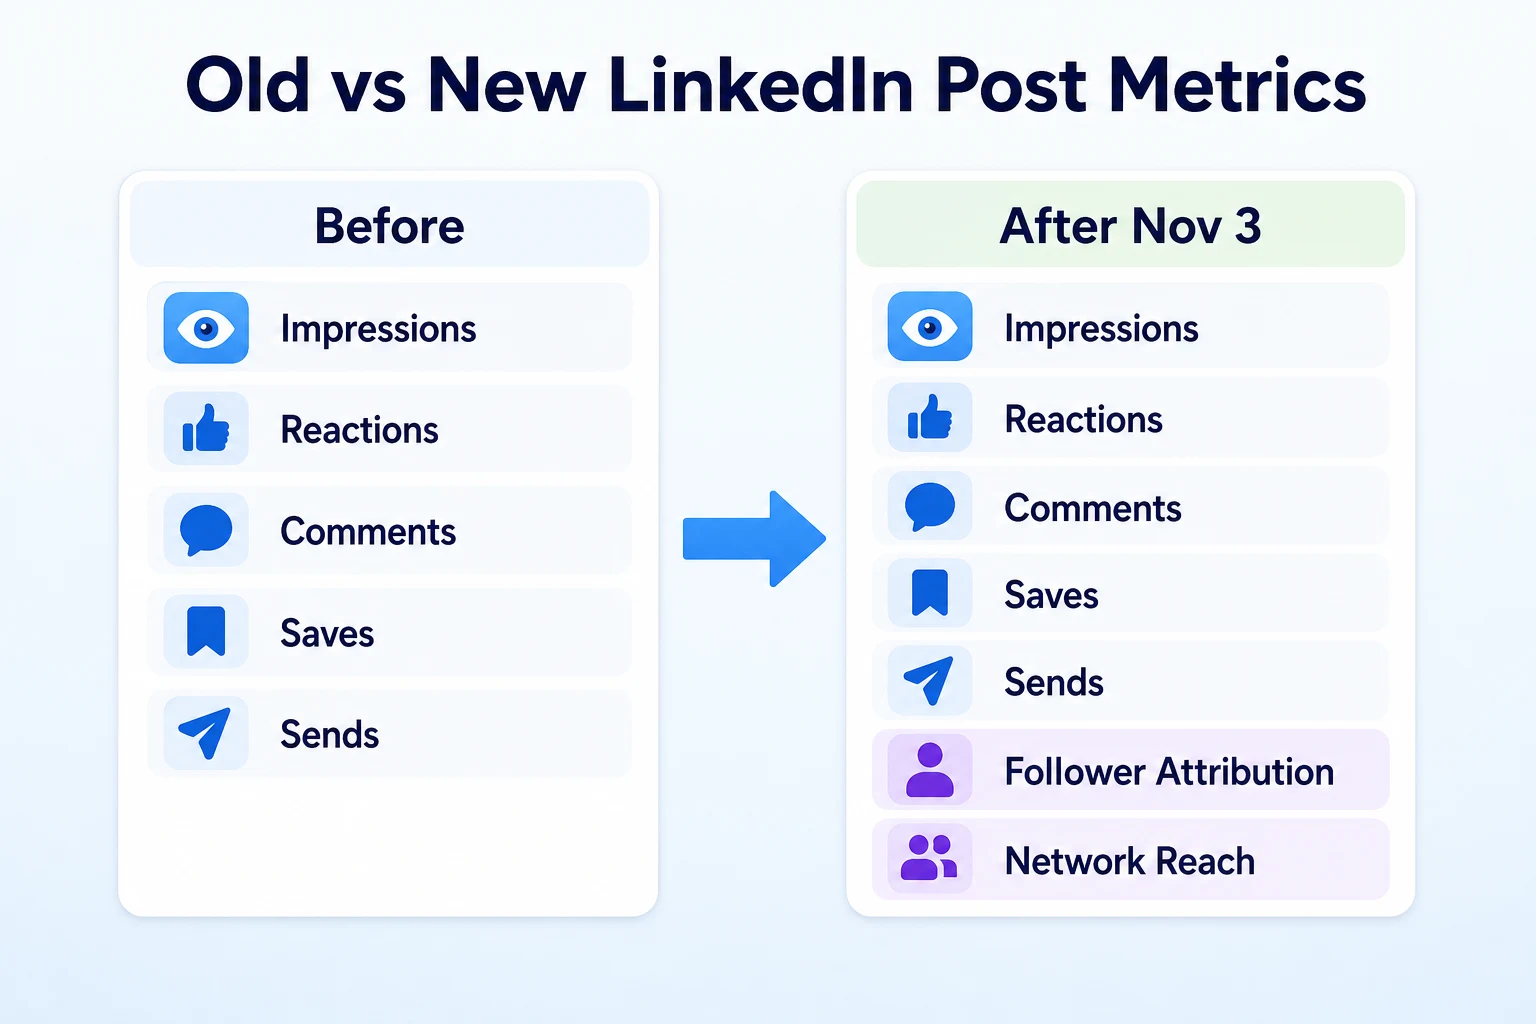
On November 3, 2026, LinkedIn announced an expanded Post Performance Table for individual posts, adding four metrics that weren't previously available in one place: saves, sends, follower attribution and network reach. LinkedIn described the update as giving creators and businesses a clearer view of how a post actually traveled and who it brought back into their audience, rather than stopping at a view or engagement count.
The four metrics in brief
Saves show how many people bookmarked a post to come back to later. Sends show how many times a post was shared through LinkedIn's direct messaging, rather than reposted publicly. Follower attribution ties new followers to the specific post that brought them in. Network reach shows how far a post spread through the connections and networks of the people who engaged with it, as distinct from a raw impression count.
Why LinkedIn is expanding post analytics now
LinkedIn hasn't published a detailed explanation of the timing beyond presenting this as part of ongoing work on creator and business tools. It fits a pattern worth noticing, though: platforms that rely on creators and brands posting consistently tend to add analytics that reward the kind of content that keeps people on the platform longer, like saves and sends, rather than only content that's quick to react to. Our piece on LinkedIn creator monetization 2026 covers a related shift: LinkedIn investing more in the tools and incentives that keep creators posting regularly, and this analytics update reads as part of that same direction.
Inside the New Post Performance Table
The four new metrics don't replace what was already there. They sit alongside the metrics a LinkedIn user has likely seen for years, in a single table attached to each post.
Where to find the Post Performance Table
LinkedIn's description places the Post Performance Table within a post's own analytics view, accessible from the post itself rather than buried in a separate dashboard. LinkedIn hasn't published full detail on whether the table looks identical on mobile and desktop, so it's worth checking both if you manage a page from more than one device.
How it sits alongside existing engagement metrics
Impressions, reactions and comments still appear in the same table. What's changed is that a post now carries a fuller picture: how many people saw it, how many reacted publicly, and also how many saved it, sent it privately, followed the author because of it, or helped it travel further through their own network.
Metric | What it shows | Available before November 3 |
|---|---|---|
Impressions | How many times the post was shown | Yes |
Reactions | Likes and other reaction types | Yes |
Comments | Public replies to the post | Yes |
Saves | How many people bookmarked the post | No |
Sends | How many times the post was shared through direct messages | No |
Follower attribution | New followers tied to that specific post | No |
Network reach | How far the post spread through connections beyond direct impressions | No |
Saves: What They Measure and Why They Matter
Of the four new metrics, saves are the easiest to understand and arguably the most useful for judging whether a post was actually worth someone's time.
What counts as a save
A save happens when someone bookmarks a post to find again later, using LinkedIn's save feature rather than reacting or commenting on it in the moment. It's a private action. The person who saved a post doesn't show up in a visible list the way a comment or a reaction does, so the count on the Post Performance Table is often the only way to see it at all.
What a high save count tells you about a post
A reaction can happen in a second, without much thought. A save takes a bit more intent: someone decided the post had information or a reference they wanted to come back to. That makes saves a reasonable signal of real usefulness, separate from how entertaining or agreeable a post seemed at first glance. A post with modest reactions but a strong save count may be doing more for your credibility than a post with the opposite pattern, even if the reaction count looks more impressive at a glance.
Sends: What They Measure and Why They Matter
Sends work differently from saves, and they tell you something a public share or a comment count can't.
What counts as a send
A send is counted when someone shares a post through LinkedIn's direct messages, sending it privately to a specific connection or a small group rather than reposting it to their own network. LinkedIn hasn't published whether sends include every private sharing path on the platform or only messages sent through a specific feature, so it's worth treating the number as a solid directional signal rather than an exact count of every private mention of a post.
Why sends can matter more for B2B content than public shares
A public share says a post resonated broadly enough that someone wanted their own network to see it. A send says something more specific: someone thought of a particular person while reading it and decided it was worth passing along directly. For B2B content aimed at a narrower audience, like a specific role, industry or company size, that kind of direct, person-to-person pass-along can matter more than a wide public share from someone outside the target audience entirely. A post about a niche compliance change, for example, might never go viral publicly but could still get sent repeatedly between people who deal with that exact problem.
Follower Attribution: Which Posts Bring New Followers
Follower growth has always been easy to track at the account level and hard to explain at the post level. This update closes that gap.
How follower attribution is tied to a single post
LinkedIn's description of follower attribution links a new follower to the specific post that was on screen when they chose to follow, rather than crediting that follow to the account in general. That means a post from three weeks ago that's still circulating can keep adding to its own follower count, separate from whatever else has been published since. LinkedIn hasn't published the exact window it uses to decide which post gets credit when someone follows shortly after seeing several posts in a row, so a reasonable assumption is that it's based on the most immediate action rather than a long lookback.
Using it to spot which topics grow your audience
Reactions and comments tell you what people responded to in the moment. Follower attribution tells you something more durable: what made someone decide they wanted to see more from you going forward. Those two things don't always line up. A post that sparks a lively comment section might bring in very few new followers, while a quieter, more instructional post might convince several people to follow who never commented at all. Over a handful of posts, this is one of the clearer ways to see which topics or formats are actually building an audience, rather than just generating a short burst of activity.
Network Reach vs Impressions: What Changed
Reach and impressions sound similar enough that it's worth being precise about what each one actually counts, especially now that both sit in the same table.
Reach versus impressions, plainly
Impressions count how many times a post was shown, including repeat views by the same person. Network reach, as LinkedIn describes it, accounts for how far a post traveled through the connections of the people who engaged with it, which is a different kind of number: it's less about raw visibility and more about how much a post spread beyond the audience that saw it directly. A post can have high impressions simply because it was shown to a large existing audience, while a post with a smaller starting audience but a lot of engagement could end up with reach that outpaces what its initial visibility would suggest.
What a wide reach but low engagement might mean
A post with wide reach but few saves, sends or comments was probably shown to a lot of people without giving many of them a reason to act on it. That's worth noticing, because it usually points to a topic or format that's broadly visible but not particularly sticky. The reverse pattern, narrower reach paired with strong saves and sends, often points to content that resonates deeply with a smaller audience, which can be exactly what a B2B brand wants even if the raw numbers look modest next to a post that simply reached more people.
Metric | What it measures | What a high or low number suggests |
|---|---|---|
Impressions | Raw number of times a post was shown | High alone just means visibility, not interest |
Network reach | How far a post spread through connections beyond its initial audience | High reach with low engagement suggests broad but shallow interest |
Saves | How many people bookmarked the post | High saves suggest lasting usefulness, not just a quick reaction |
Sends | How many times the post was shared privately | High sends suggest the content was relevant to a specific person or small group |
Follower attribution | New followers tied to that specific post | High attribution suggests the post convinced people to want more from the account |
Who Has Access Right Now
Not every LinkedIn account has the same view of these new metrics yet, and the distinction between account types matters here.
Creator accounts vs company pages
LinkedIn's announcement described the Post Performance Table as rolling out to creators and business pages, without laying out a precise schedule for when each account type gets full access. It's reasonable to expect some lag between personal creator accounts and company pages, since LinkedIn has historically staggered feature rollouts between the two rather than releasing them at the same moment. LinkedIn hasn't published a stated reason for any gap, so an account manager checking both a personal profile and a company page shouldn't assume a missing feature on one means something is broken.
What to do if you don't see it yet
If the new metrics haven't appeared on a post yet, the simplest first step is checking a few different recent posts, since LinkedIn hasn't confirmed whether older posts are included in the rollout at the same time as new ones. It's also worth checking that the LinkedIn app or browser session is fully updated, since analytics features sometimes appear after a refresh rather than instantly. Beyond that, there isn't a documented workaround. LinkedIn hasn't published a way to manually request early access to the Post Performance Table.
What's Confirmed and What LinkedIn Hasn't Said Yet
It's worth separating what LinkedIn has actually stated about this update from what's left for an account manager to figure out by testing it directly.
LinkedIn confirmed the November 3, 2026 rollout date, the four new metrics (saves, sends, follower attribution and network reach), and that they appear inside a Post Performance Table attached to individual posts. LinkedIn also described the rollout as reaching creators and business pages, without a published schedule for exactly when each account type gets full access.
What LinkedIn hasn't published is a full timeline for when every account will see the feature, whether historical posts get the new metrics applied retroactively or only posts published after November 3, whether the data can be exported for reporting outside LinkedIn, and how closely mobile and desktop views match each other.
Question | What's confirmed | What's still unclear |
|---|---|---|
When did this launch? | November 3, 2026 | Full timeline for reaching every account |
Who gets access? | Creators and business pages, per LinkedIn's announcement | Whether company pages lag behind personal creator accounts |
Do older posts get the new metrics? | Not addressed directly | Whether the Post Performance Table applies retroactively or only to new posts |
Can the data be exported? | Not addressed in the announcement | Whether saves, sends and reach can be pulled into a spreadsheet or report |
Until LinkedIn publishes more detail on these points, the safest approach is to check your own account directly rather than assume a feature works a certain way based on what another account shows.
A Worked Example: Reading One Week of Post Performance Data
This example is illustrative, not a record of a real business's results.
Imagine a small consulting firm that posts five times over a single week and checks the Post Performance Table for each one once the new metrics settle.
Post topic | Impressions | Network reach | Saves | Sends | New followers |
|---|---|---|---|---|---|
Industry trend commentary | 4,200 | 5,600 | 18 | 6 | 3 |
Quick tip post | 2,900 | 3,100 | 41 | 22 | 9 |
Company announcement | 3,500 | 3,700 | 5 | 2 | 1 |
Client success story | 2,100 | 2,400 | 12 | 14 | 7 |
Personal reflection post | 1,800 | 3,900 | 9 | 4 | 5 |
These figures are illustrative.
Read on reactions alone, the industry trend post would look like the week's winner, since it drew the most impressions. The new metrics tell a different story. The quick tip post generated the most saves and sends by a wide margin, and brought in three times as many new followers as the trend post. The client success story had modest reach but a strong send count, suggesting it got passed directly to people who might actually hire the firm. The personal reflection post had the lowest impressions of the week but the second-highest reach, meaning it traveled further through connections than its starting audience would suggest.
None of this means the firm should stop posting industry commentary. It means a single week of saves, sends and follower attribution already points toward practical, specific content as the format doing more of the real work, something the impression count alone would have hidden completely.
A 30-Day Plan to Turn These Metrics Into a Content Strategy
A month is enough time to move from noticing these numbers to actually using them.
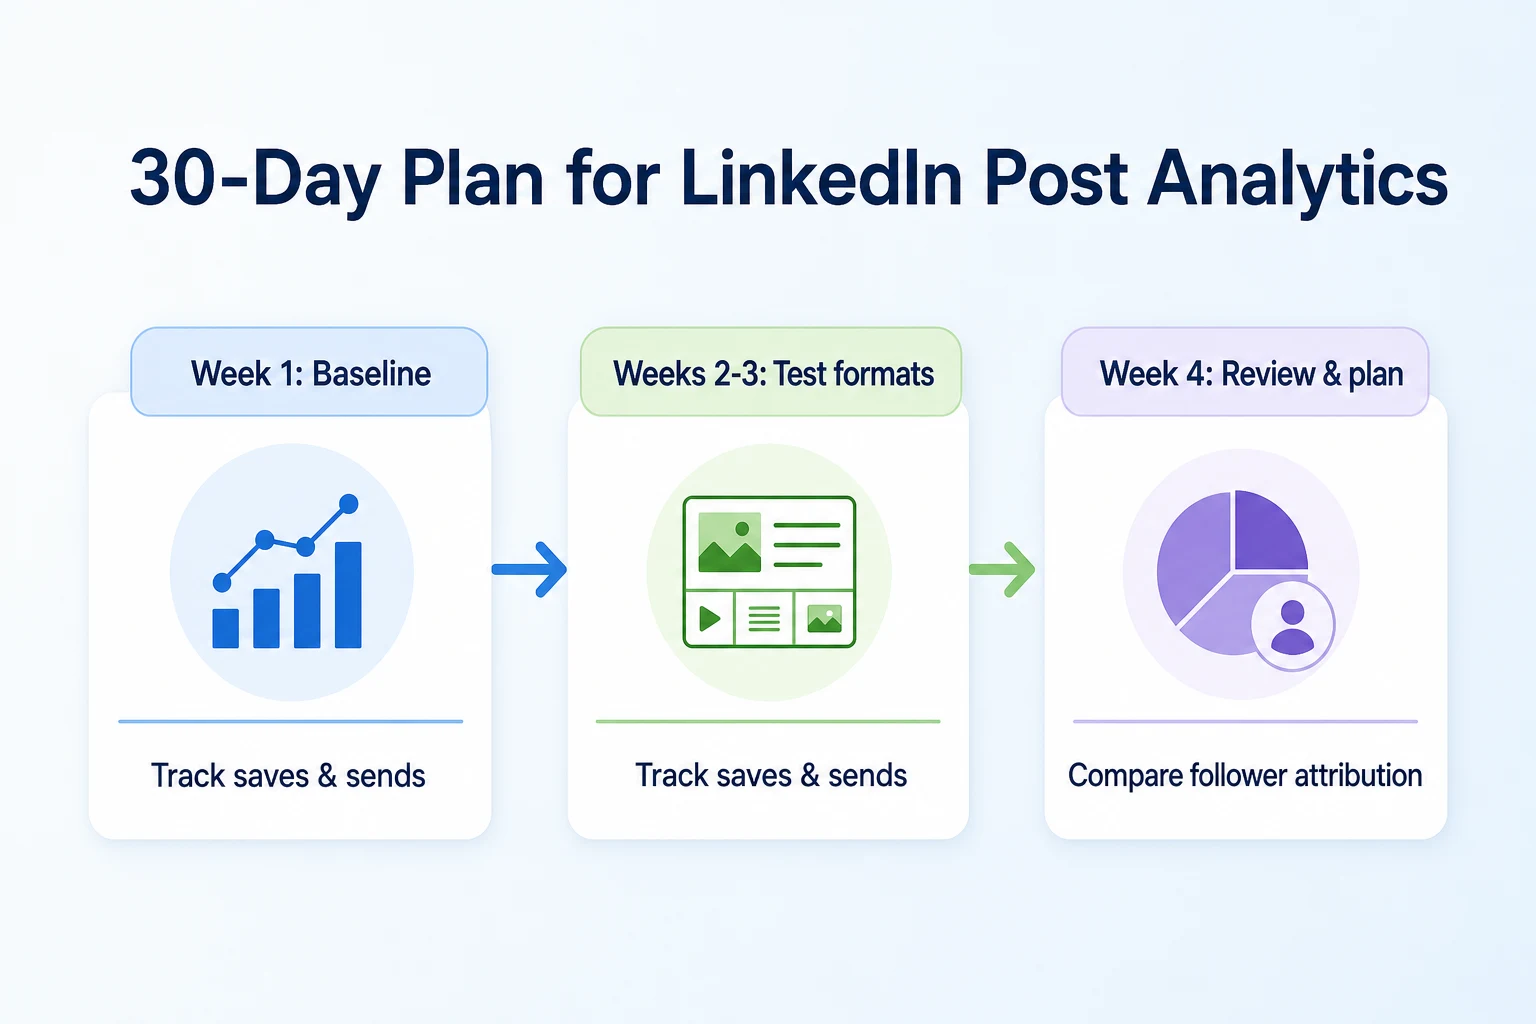
Week 1: Establish a baseline
Post as normal for the first week, but check the Post Performance Table for every post rather than skimming impressions and reactions out of habit. Write down saves, sends, reach and follower attribution for each one, even if the numbers feel small. This week isn't about changing anything yet. It's about having real figures to compare against once you start testing.
Weeks 2 to 3: Test and compare
Vary format deliberately across these two weeks: a mix of practical tips, opinion posts, and whatever else fits the business. Keep the same tracking habit from week one, and start comparing which formats pull in more saves and sends relative to their impressions, not just which ones get the most reactions. A content calendar helps here, since it's easier to see the pattern when posts are planned rather than scattered. Our guide to building an SEO content calendar covers a similar planning approach for a website's blog, and the same discipline of planning ahead and tracking results applies to a LinkedIn posting schedule.
Week 4: Review and plan the next month
Look back at four weeks of data side by side. Identify which two or three formats consistently produced strong saves, sends or follower attribution relative to their reach, and plan the next month's posts around more of that, while still leaving room to test something new. Treat this as an ongoing cycle rather than a one-time exercise, since what works tends to shift as an audience and a platform's own features keep changing.
Common Mistakes to Avoid With the New Metrics
A new set of numbers invites new ways to misread them, especially in the first few weeks after they appear.
Mistake | Why it backfires | Better move |
|---|---|---|
Chasing impressions over saves and sends | A post can reach a huge audience and still fail to convince anyone to act, follow or come back to it | Weigh saves, sends and follower attribution alongside reach, not behind it |
Judging a strategy from one post | A single post's numbers can swing on timing, topic or luck, and don't reflect a pattern yet | Wait for several posts across a few weeks before drawing a conclusion |
Comparing very different post types directly | A quick tip and a long-form story naturally draw different save and send patterns | Compare similar formats against each other, not a company update against a personal story |
Ignoring follower attribution because it's a smaller number | A modest follower count tied to one post can still be the clearest sign of what's growing an audience | Track it over time rather than dismissing it next to bigger impression numbers |
Assuming every account sees the same features at the same time | LinkedIn hasn't published a full rollout schedule, so a missing metric isn't necessarily a problem | Check back periodically rather than assuming something is broken |
Where RepGet fits
RepGet has no connection to LinkedIn's analytics, its Post Performance Table, or any of the metrics covered here. It doesn't post to LinkedIn, pull LinkedIn data, or track saves, sends or follower attribution.
What RepGet works on is a related question that comes up the moment a business starts paying attention to which content actually gets saved and shared rather than just seen: whether the website behind that content is giving visitors a reason to stay, and whether the same topics that perform well on LinkedIn are covered clearly enough on the site itself. A quick tip post that brings in new followers often points to a topic worth a proper page or article on the business's own site, somewhere a reader can go deeper than a single post allows. RepGet's website auditing, keyword research, content planning and article writing work on exactly that layer, helping a business turn a topic that proved itself on social media into content that also works for search.
If a business wants to check how its own site holds up before building more content around what's working on LinkedIn, RepGet's free website audit crawls the site and gives it a 0 to 100 SEO score, flagging technical and content issues worth fixing first. No account or credit card required. RepGet's free SEO tools cover related checks, like whether a page's title and description give a visitor a reason to click through once they've found it.
RepGet doesn't manage a LinkedIn page, doesn't track saves or sends, and doesn't guarantee that a post performing well on LinkedIn will translate into rankings, traffic or new business. What it can do is make sure the website a business sends people to, including anyone a LinkedIn post convinces to look further, is ready for them.
The bottom line
LinkedIn's November 3 update adds four real, documented metrics to the Post Performance Table: saves, sends, follower attribution and network reach. Together they give a clearer picture of what a post actually did, not just how many times it was shown, which matters more for a business trying to grow an audience than a reaction count ever did on its own.
What's still unclear is how quickly every account gets full access, whether older posts are included, and whether the data can be exported for reporting elsewhere. Until LinkedIn publishes more on those points, the practical move is to check your own account directly, track the new numbers for a few weeks, and let saves, sends and follower attribution guide what you post next, rather than guessing from a single post or another account's results.
Find out what your website needs first
Run a free website audit with RepGet to see what your site needs before turning a well-performing LinkedIn topic into a page or article of its own. No account or credit card required.
FAQ
What is LinkedIn's new Post Performance Table?
It's a table LinkedIn added to individual post analytics on November 3, 2026, showing impressions, reactions and comments alongside four new metrics: saves, sends, follower attribution and network reach.
What does a 'save' mean on LinkedIn?
A save happens when someone bookmarks a post to find again later, using LinkedIn's save feature rather than reacting publicly. It's a private action, so the Post Performance Table is often the only place to see the count.
What counts as a 'send' on a LinkedIn post?
A send is counted when someone shares a post through LinkedIn's direct messages to a specific connection or small group, rather than reposting it publicly to their own network.
How does LinkedIn's follower attribution work?
Follower attribution ties a new follower to the specific post that was on screen when they chose to follow, rather than crediting the follow to the account in general.
Is network reach the same as impressions on LinkedIn?
No. Impressions count how many times a post was shown, including repeat views, while network reach measures how far a post traveled through the connections of people who engaged with it.
Who can see the new LinkedIn analytics features?
LinkedIn described the Post Performance Table as rolling out to creators and business pages, without publishing a precise schedule, so some accounts may see it before others.
When did LinkedIn add saves and sends to post analytics?
LinkedIn announced the update, including saves, sends, follower attribution and network reach, on November 3, 2026, as part of an expanded Post Performance Table.
How can I use LinkedIn post analytics to improve my content?
Track saves, sends and follower attribution for several posts over a few weeks, compare similar formats against each other, and lean into whichever topics consistently drive those numbers rather than just impressions.